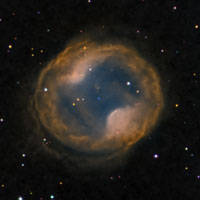
PK164+31.1, also known as Jones-Emberson 1, is a planetary nebula positioned in the celestial Southern Hemisphere, in the discreet Lynx constellation. Its low surface brightness and moderate angular size (six arcminutes, similar to a one euro coin seen from 15 meters distance) make it hard to discern with a telescope, which makes for its relative lack of fame. It is, however, a very attractive target for astrophotography.
Planetary nebulae represent the final stage in the life of low-mass stars (those below eight solar masses). During their final energetic breakdown, these objects expel their outer layers towards interstellar space, and this material is ionized and illuminated by the stellar cadaver left in its center, a white dwarf. Our own Sun will go through this process in approximately five thousand million years.
PK164+31.1 lies approximately 1600 light-years away, and its small apparent size translates into a diameter of approximately 3 light-years, a distance similar to that from the Sun to its nearest stellar neighbour, alpha Centauri. Thus, if an astrophographer living in a planet close to PK164+31.1 took an image of our Sun, both ourselves and alpha Centauri would fit in a circle with the apparent size PK164+31.1 shows to us.
The above text is taken from PixInsight image gallery.
Mouseover of the small thumbnails to the left will show the five different versions two narrowband images (Ha and OIII).
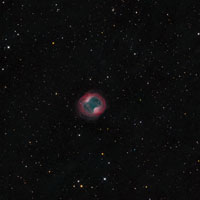
ARGB Standard: R = Ha, G = OIII, B = 85%OIII + 15%Ha. The top-left thumbnail is a standard Bi-color RGB combination
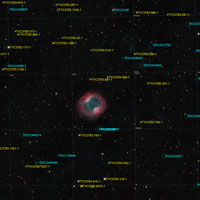
ARGB Standard annonated: The top-middle thumbnail is based on the top-left - with annonations of nearby stars and galaxies added.
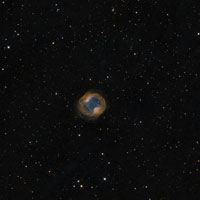
Hubble like: The top-right thumbnail is a Hubble like composition (Orange = Ha, Cyan = OIII), given to increase contrast in the nebulosity.
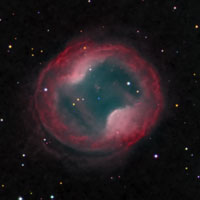
ARGB Standard uppscaled: The bottom left thumbnail is just an 100% crop of "ARGB Standard" above.
Hubble like uppscaled: The bottom right thumbnail is just an 100% crop of "Hubble like" above.
In order to make most use of the data I have also used JP Metsavainio's Tone Mapping technique. A pdf that outlines tone mapping can be found here, and in order to bring out as much details as possible I have followed some of the tutorials on Ken Crawford's site.
Below you see images for each emission line respectively. The images has been stacked and stretched so that the histogram peak is equal for each of them.
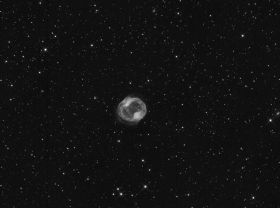
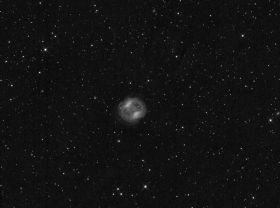
Ha OIII
The following software has been used. MaximDL (image acquisition and guiding), CCDStack (calibration and RGB scaling, PixInsight (cropping, background correction, colour corrections) and Photoshop CS5 (all the rest, incl Noel Carbonis Astronomy Tools), and finally JP Metsavainio's Tone Mapping technique.
This image was processed in June 2013